Introduction - Statistics, Biostatistics, Requency distribution ||Pharma...
 What is Statistics?

- Statistics is a scientific study of Numerical data based on natural Phenomena.
- It is also the science of collecting, organizing, interpreting, and reporting data.
ContentWhat is Statistics?Statistics and its applicationWhat is Biostatistics? Application and Use1. The Physiology and anatomy 2. In Pharmacology 3. Medicine 4. In geneticsScope of biostatistics What is frequency distribution? Types of frequency distribution1. Relative frequency distribution2. Cumulative frequency distribution Cumulative relative frequency distribution Formula Graphic presentations of frequency distribution 1. Histograms2. Polygons 3. Cumulative frequency distributionAdvantages and limitations of frequency distributionConclusion
Statistics and its application
- Public health, including epidemiology, health services research, nutrition, environmental health.
- Design and analysis of clinical trials in medicine
- Demographic studies: age, gender, height, weight, BMI
- Design and analysis of clinical trials in medicine.
- Analysis of genomics data, for example From microarray or proteomics experiments. Often concerning diseases or disease.
What is Biostatistics? Biostatistics is the branch of science which deals with the theories and methods of collection analysis and interpretation of data.
Application and UseBiostatistics is applied and used in different branches of bioscience.
1. The Physiology and anatomy 1.To define what is normal or healthy in a population and to find limits of normality in variables.2. To find the difference between the mean and proportion of normal at two places or in different periods.3. To find and correlation between two variables x and y such as height and weight.
- Public health, including epidemiology, health services research, nutrition, environmental health.
- Design and analysis of clinical trials in medicine
- Demographic studies: age, gender, height, weight, BMI
- Design and analysis of clinical trials in medicine.
- Analysis of genomics data, for example From microarray or proteomics experiments. Often concerning diseases or disease.
2. In Pharmacology
- To know the action of drug give to animals and humans to observe the changes produced are due to drug or by chance.
- To find out the relative potency of a new drug with respect to a standard drug.
- To know the action of drug give to animals and humans to observe the changes produced are due to drug or by chance.
- To find out the relative potency of a new drug with respect to a standard drug.
3. Medicine
Compare efficacy of a particular drug for this percentage of cured and died in the experiment and control groups is done.
To find out an association between 2 attributes such as cancer and smoking.
In Community medicine and public health
In epidemiological studies -the role of causative factors in statistically tested.
In Public health, the measures adopted are evaluated.
4. In genetics
Biostatics is used in studying genetics.Medals law's of inheritance is tested by x2 test.Hardy Weinberg's law is tested by biostatistician methods.
Scope of biostatistics
Use of statistical methods are constantly increasing in biological sciences.
Heredity one of the recent branches of biology is mainly base on biostatics.
What is frequency distribution?
In statistics, a frequency distribution is a table that displays the frequency of various outcomes in a sample. each entry in the table contains the frequency or count of the occurrences of values within a particular group or interval, and in this way, the table summarizes the distribution of values in the samples.A frequency distribution a show summarized grouping of data divided into mutually exclusive classes and the number of occurrences in a class. It is a way of showing unorganized data.
e.g. to show results of an election, income of people for a certain region, sales of product within a certain period, student loan amounts of graduates, etc
Some of the graphs that can be used with frequency distributions are histograms, line charts, bar charts, and pie charts.
Frequency distributions are used for both qualitative and quantitative data.
Types of frequency distribution
1. Relative frequency distribution
2. Cumulative frequency distribution
A frequency distribution a show summarized grouping of data divided into mutually exclusive classes and the number of occurrences in a class. It is a way of showing unorganized data.
e.g. to show results of an election, income of people for a certain region, sales of product within a certain period, student loan amounts of graduates, etc
Some of the graphs that can be used with frequency distributions are histograms, line charts, bar charts, and pie charts.
Frequency distributions are used for both qualitative and quantitative data.
Types of frequency distribution
1. Relative frequency distribution
2. Cumulative frequency distribution
1. Relative frequency distribution
A frequency distribution where each of the class frequencies is divided by the total no of observations.

2. Cumulative frequency distribution
Technically, a cumulative frequency distribution is the sum of the class and all classes below it in a frequency distribution.
All that means is you are adding up a value and all of the values that came before it.
Technically, a cumulative frequency distribution is the sum of the class and all classes below it in a frequency distribution.
All that means is you are adding up a value and all of the values that came before it.
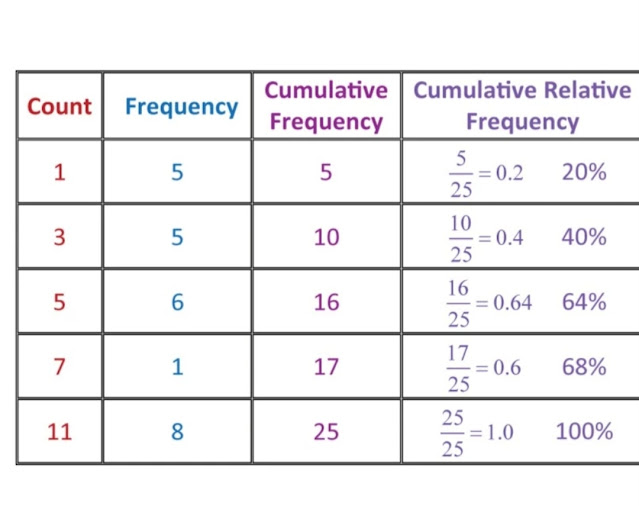
Cumulative relative frequency distribution
Cumulative relative frequency is a statistical calculation figured by adding together previously
tabulated relative frequencies that make a running total along with a frequency table.
The relationship between cumulative frequency and relative cumulative frequency is given by ;
Cumulative relative frequency is a statistical calculation figured by adding together previously
tabulated relative frequencies that make a running total along with a frequency table.

The relationship between cumulative frequency and relative cumulative frequency is given by ;
formula;
Cumulative relative frequency = Cumulative frequency / Sample size
Graphic presentations of frequency distribution
1. Histograms
A histogram is a graphical representation that organizes a group of data points into user-specified ranges.

2. Polygons
Frequency polygons are a graphical device for understanding the shapes of distributions.

3. Cumulative frequency distribution
A cumulative frequency graph of a quantitative variable is a curve graphically showing the cumulative frequency distribution.

Advantages and limitations of frequency distribution
- Condense and summarize large amounts of data in a useful format.
- Describe all variable types.
- Facilitate graphic presentation of data.
- Begin to identify population characteristics.
- Permit cautious comparison of data sets.
Conclusion
In this post, we discuss Statistics, Biostatics, Frequency distribution. Cumulative relative frequency formula and Graphic presentations of frequency distribution their advantages, use, and limitations. (BP 801T Biostatistics and Research Methodology ).
Comments
Post a Comment